python Library
CIEcolorCoordinates_Spectrum
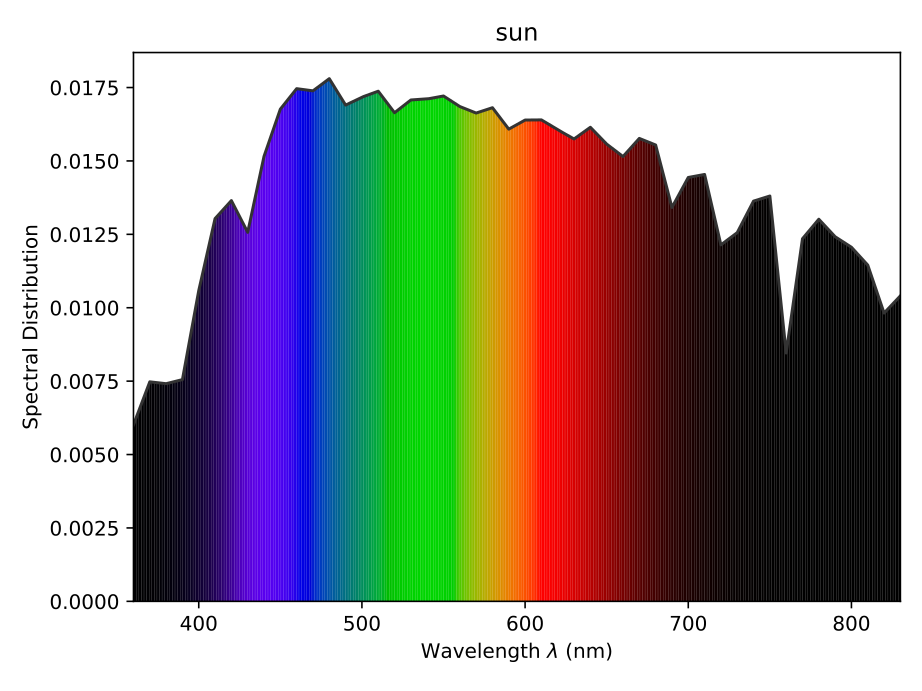
Read spectral data from file, compute the CIE color coordinates, plot a colorful spectrum.
import   matplotlib
import   matplotlib.pyplot as   plt
import   numpy as   np
import   math
import   os
import   colour
import   colour.plotting as   cplt

#==================================================#
def   spectrum2spd(spectrum,title):
    """
    convert numpy spectrum to spd
    """
    NoWl=spectrum.shape[0]
    specDict = {}
    for   i in range(NoWl):
        specDict[int(spectrum[i,0])] = spectrum[i,1]

    spd = colour.SpectralDistribution(specDict, name=title)
    return spd

#==================================================#
def   evaluateSpectrum(spd,title):
    """
    Calculate the sample spectral distribution *CIE XYZ* tristimulus values.
    """
    cmfs = colour.STANDARD_OBSERVERS_CMFS['CIE 1931 2 Degree Standard Observer']
    illuminant = colour.ILLUMINANTS_SDS['D65']
    XYZ = colour.sd_to_XYZ(spd, cmfs, illuminant)
    Vlambda = XYZ[1]
    CIE = colour.XYZ_to_xy(XYZ)

    return Vlambda,CIE[0],CIE[1]

#==================================================#
def   plotSpectrum(spd,fileName,title):
    """
    plot colorfull spectrum to file
    """

    plt.ioff() # Turn interactive plotting off

    fig,ax = cplt.plot_single_sd(spd)
    ax.set_title(title)
    ax.set_facecolor((1.0, 1.0, 1.0))
    fig.savefig(fileName)

#==================================================#
def   readData2NpSpectrum(file,wlMin,wlMax,NoWl,delimiter,indexWL=0,indexSpec=1,header=0):
    """
    import   spectrum from file
    take average, if there are multiple values within a wave length interval
    """
    DeltaWl = (wlMax-wlMin)/(NoWl-1)
    spectrum = np.zeros((NoWl,2))
    wlIndex={}
    for   i in range(NoWl):
        thisWl = round(wlMin + i/(NoWl-1)*(wlMax-wlMin))
        spectrum[i,0]   = thisWl
        wlIndex[thisWl] = i

    counterWl = np.zeros((NoWl))
    fp = open(file, mode='r')
    lines = fp.readlines()[header:] #drop header lines
    for   l in lines:
        values = l.strip().split(delimiter)
        thisWl   = float(values[indexWL])
        thisSpec = float(values[indexSpec])
        for   i in range(NoWl-1):
            if (thisWl > spectrum[i,0]-0.5*DeltaWl) and (thisWl <= spectrum[i,0]+0.5*DeltaWl):
                spectrum[i,1] = spectrum[i,1] + thisSpec
                counterWl[i] = counterWl[i]+1
                break;
    fp.close()

    sumSpectrum = 0
    for   i in range(NoWl):
        spectrum[i,1] = spectrum[i,1] / max(1,counterWl[i])
        sumSpectrum = sumSpectrum + spectrum[i,1]

    for   i in range(NoWl):
        spectrum[i,1] = spectrum[i,1] / sumSpectrum

    return spectrum

#==================================================#
if __name__ == "__main__":
    fileName = "sunSpectrum.txt"
    indexWL=0
    indexSpec=1
    header = 1
    title = "sun"
    delimiter="\t"

    NoWl = 221
    wlMin=300
    wlMax=wlMin+NoWl*5

    spectrum = readData2NpSpectrum(fileName,wlMin,wlMax,NoWl,delimiter,indexWL,indexSpec,header)
    spd = spectrum2spd(spectrum,title)
    Vlambda,CIE_x,CIE_y = evaluateSpectrum(spd,title)
    plotSpectrum(spd,title+"Spectrum.svg",title)
Index of Library
Der gesamte Sourcecode darf gemäß GNU General Public License weiterverbreitet werden.