python Library
showPointOnCIExy
This script reads color coordinates from a file of format:
#desc   Vl      CIEx    CIEy
point1	98765	0.291	0.288
point2	98765	0.315	0.330
And indicates these position on the CIE color horse shoe.
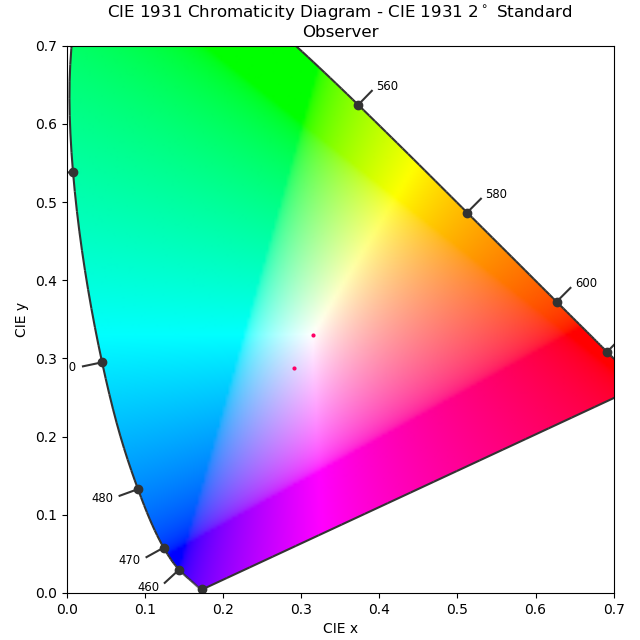
"""
Script to plot sets of color-points on top of CIE color horse shoe
"""
import  matplotlib.pyplot as  plt
import  numpy as  np
import  os
import  colour.plotting as  cplt
import  colour
import  readData2DictOfArrays as  rd


#==================================================#
def  pointOnCIE(x,y,color,legend):
    # https://scipython.com/blog/converting-a-spectrum-to-a-colour/
    # http://markkness.net/colorpy/ColorPy.html

    fig,axis = cplt.chromaticity_diagram_plot_CIE1931(cmfs='CIE 1931 2 Degree Standard Observer', show_diagram_colours=True, use_cached_diagram_colours=True)

    axis.set_xlim(0,0.7)
    axis.set_ylim(0,0.7)
    for  i in range(len(c)):
        axis.scatter(x[i],y[i], color=color[i], marker='.', linewidths=0, edgecolors='black')


    #fig.legend(legend)
    fig.savefig('myCIE.png')
    print('view myCIE.png')


#==================================================#
if __name__ == "__main__":
    """
    myData.txt looks like:
    #desc   Vl      CIEx    CIEy
    myDat   98765   0.291   0.288
    """
    x = []
    y = []
    c = []
    l = []
    filename = "myData.txt"
    data = rd.readData2DictOfArrays(filename,"\t")
    x.append(data['CIEx'])
    y.append(data['CIEy'])
    c.append(" #ff0066")
    l.append("my data")
    pointOnCIE(x,y,c,l)
Index of Library
Der gesamte Sourcecode darf gemäß GNU General Public License weiterverbreitet werden.